Graphics
The following graphic files were created by the FCIC to help illustrate a number of issues the Commission highlighted in its public hearings and in its final report.
Housing

In 2006, $600 billion of subprime loans were originated, most of which were securitized. That year, subprime lending accounted for 23.5% of all mortgage originations.

Arizona, California, Florida, and Nevada - the "sand states" — had the most problem loans.

Serious delinquencies started earlier and were substantially higher among subprime adjustable-rate loans, compared with other loan types.

The crisis wiped out much more wealth than other recent events such as the bursting of the dot-com bubble in 2000.
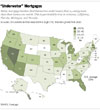
Many mortgage holders find themselves underwater; that is, owing more than their homes are worth. This is particularly true in Arizona, California, Florida, Michigan, and Nevada.

The United States was one of many countries to experience rapid home price growth.
Finance

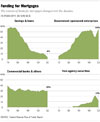
The funding available through the shadow banking system grew sharply in the 2000s, exceeding the traditional banking system in the years before crisis.

In the 1990s, many kinds of loans were packaged into asset-backed securities.

Compensation in the financial sector outstripped pay elsewhere, a pattern not seen since the years before the great Depression.

Rates for both banks and homeowners have been low in recent years.

At the onset of the crisis in the summer of 2007, asset-backed commercial paper outstanding dropped as concerns about asset quality quickly spread. By the end of 2007, the amount outstanding had dropped nearly $400 billion.

In the four days before Bear Stearns collapsed, the company's liquidity dropped by $16 billion.

Notional amount and gross market value of OTC derivatives outstanding; in trillions of dollars, semiannual.

As concerns about the health of bank counterparties spread, lending banks demanded higher interest rates to compensate for the risk. The one-month LIBOR-OIS spread measures the part of the interest rates banks paid other banks that is due to this credit risk. Strains in the interbank lending markets appeared just after the crisis began in 2007 and then peaked during the fall of 2008.

In a flight to safety, investors shifted from prime money market funds to money market funds investing in Treasury and agency securitie.

In a flight to safety, investors shifted from prime money market funds to money market funds investing in Treasury and agency securities.
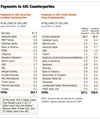
Payments to AIG securities lending counterparties in billions of dollars and payments to AIG credit default swap counterparties in billions of dollars.
Mortgage securities
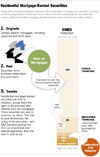
Financial institutions packaged subprime, Alt-A and other mortgages into securities.
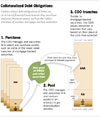
Collateralized debt obligations (CDOs) are structured financial instruments that purchase and pool financial assets such as the riskier tranches of various mortgage-backed securities.
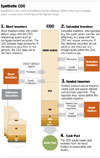
Synthetic CDO's, such as Goldman Sachs' Abacus 2004-1 deal, were complex paper transactions involving credit default swaps.
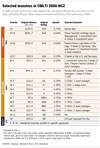
A wide variety of investors throughout the world purchased the securities in this deal, including Fannie Mae, many international banks, SIVs and many CDOs.

The GSEs purchased subprime and Alt-A nonagency securities during the 2000s. These purchases peaked in 2004.

From January 2006 through June 2007, Clayton rejected 28% of the mortgages it reviewed. Of these, 39% were waived in anyway.

Bars shows distribution of average rate of serious delinquency.

Impairment of 2005 - 2007 vintage mortgage-backed securities (MBS) and CDOs as of year-end 2009, by initial rating. A security is impaired when it is downgraded to C or Ca, or when it suffers a principal loss.

Financial organizations take mortgage-related securities and repackage the the riskier assets into multiple CDOs. This amplifies the original value of the security. Any losses are experienced by multiple investors.
